-
About BHI
About BHI
We report independently on the performance of the NSW healthcare system to inform improvements to care for patients, and enhance transparency and accountability
BLOG
Finding new and innovative ways to increase the impact of NSW patient surveys
12 April 2024
 Find out more
-
Reports
Reports
Our reports show where the healthcare system is performing well and where there are opportunities to improve care for patients
Latest report
-
Patient surveys
Patient surveys
Find out what thousands of people have told us about their healthcare experiences in NSW. The results show where public health services are performing well and where they need to improve
Latest survey results
-
Media
Media
See our latest media releases or get in touch with the team regarding our healthcare performance reports and data
Latest MEDIA RELEASE
New reports show NSW emergency departments are busier than ever but most patients remain positive about their care
Released: 13 March 2024
 Find out more
One of BHI’s commitments in our new Strategic Plan 2019–22 is to continue to enhance the value of our information products by making our performance measurement and reporting as meaningful and clearly presented as possible.
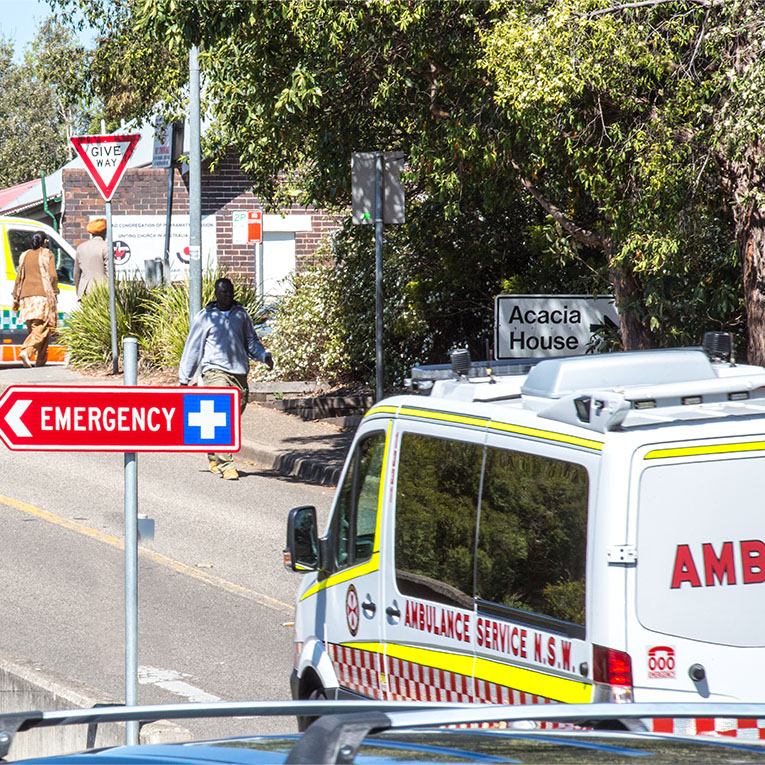
In keeping with this commitment, BHI has changed the way we report on the activity and performance of ambulance services across the state. We are now reporting measures for 91 standard geographical areas, known as Statistical Areas Level 3 (SA3s), rather than the 18 ambulance zones we previously reported on.
Implemented for the first time in our latest issue of Healthcare Quarterly, these changes are the culmination of a great deal of work both within BHI and in consultation with our colleagues at NSW Ambulance and the Ministry of Health.
BHI first introduced quarterly reporting of ambulance performance data for NSW and 18 ambulance zones in the January–March 2017 issue of Healthcare Quarterly, in conjunction with the launch of an online map-based search application that allowed users to see how ambulance services were performing in each zone.
This information allowed important new insights into the performance of NSW Ambulance, but did have limitations. The geographical ‘zones’ defined by NSW Ambulance cover large areas so zone-level performance data is of limited interest at the local level. Zone administrative boundaries are also subject to change, making comparisons over time difficult.
To enhance the ambulance activity and performance information BHI provides to the community and healthcare sector, BHI has introduced SA3-level reporting. Developed by the Australian Bureau of Statistics, SA3s are small enough to be meaningful to the community, but large enough to capture sufficient incidents to provide stable estimates of performance.
We have also introduced a new interactive ambulance performance tool that summarises key ambulance response times by SA3. This tool is a significant improvement on the previous application, with a new user-friendly graphic based on Google maps that enables users to engage more easily and intuitively with ambulance performance and activity data in their local area.
By entering their suburb or town into the tool, consumers are able to view a map of their local SA3 and its boundaries as well as a clear summary of the median ambulance response times for emergency, life-threatening and urgent cases along with performance comparisons for the same quarter the previous year.


Dr Diane Watson is BHI's Chief Executive. She has more than 30 years of senior management experience measuring, monitoring and reporting on the performance of healthcare systems in Australia and internationally.